This page will be periodically updated with the latest bicycle death statistics for bicycle-related crashes in California and across the USA.
Page last updated: September 2021
USA Bicycle Death Statistics
On average, 751 cyclists die in fatal bicycle accidents each year in the United States (for years 2007 through 2019).
According to the Federal Highway Administration (FHWA). From 2007 to 2019, 9,768 cyclists have died across the U.S. We took that number and divided it by 13 to get the average.
2018 was the deadliest year for cyclists with 871 recorded deaths. Bike deaths appear to be on the rise overall. However, the number of fatalities dipped to 846 in 2019.
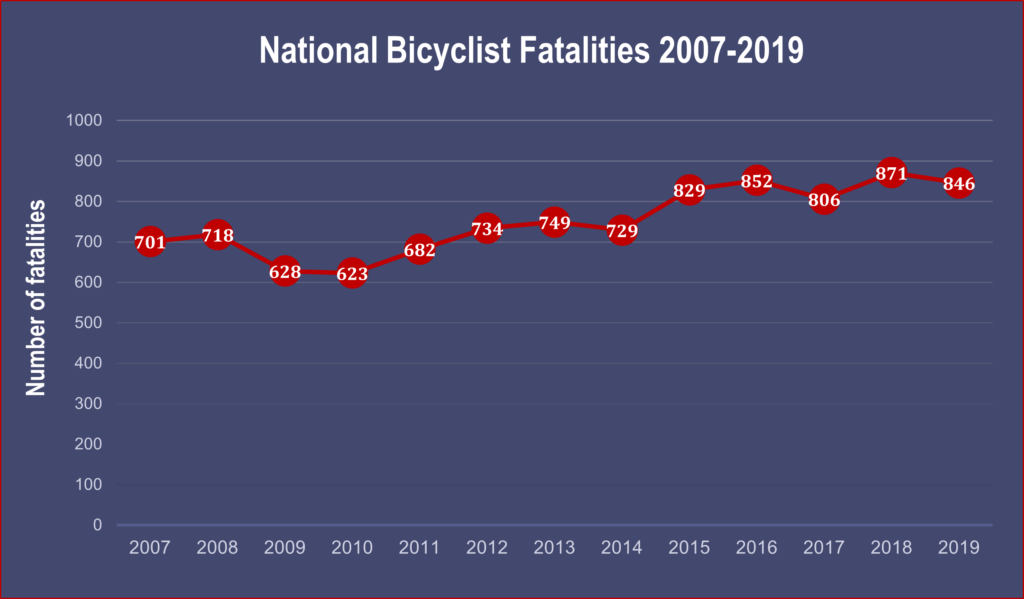
Here are the annual fatality numbers: 2007 = 701, 2008 = 718, 2009 = 628, 2010 = 623, 2011 = 682, 2012 = 734, 2013 = 749, 2014 = 729, 2015 = 829, 2016 = 852, 2017 = 806, 2018 = 857, 2019 = 846.
California Bicycle Fatal & Non-Fatal Accident Numbers
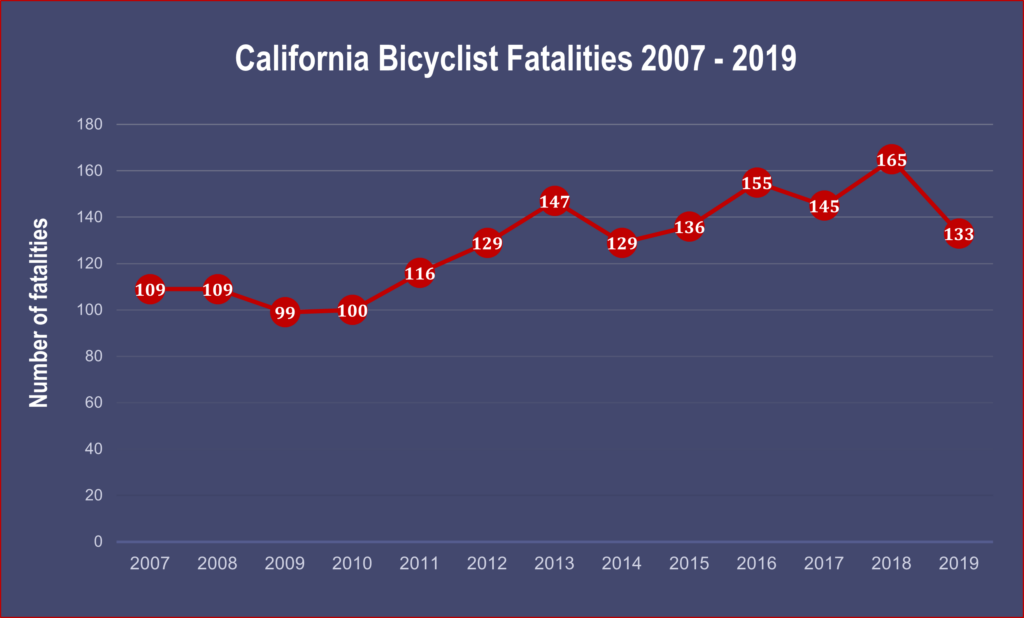
In 2019, there were 133 bicycle accident deaths in California. This was a 19.5% decrease in deaths compared with 2018, when there were 165 bicycle fatalities. (COTS)
Between 2007 and 2019, 1,672 total cyclists have died on California streets. (FHWA) Over this time span, an average of about 129 people per year died in bicycle accidents in California.
From 2016-2018, California’s cyclist Fatality Rating was 3.9 meaning 3.9 cyclist deaths per million people (CaliforniaHealthline). In comparison, Florida led the nation with a 6.8 rating. The rest of the United States averages around 2.9 deaths per million people.
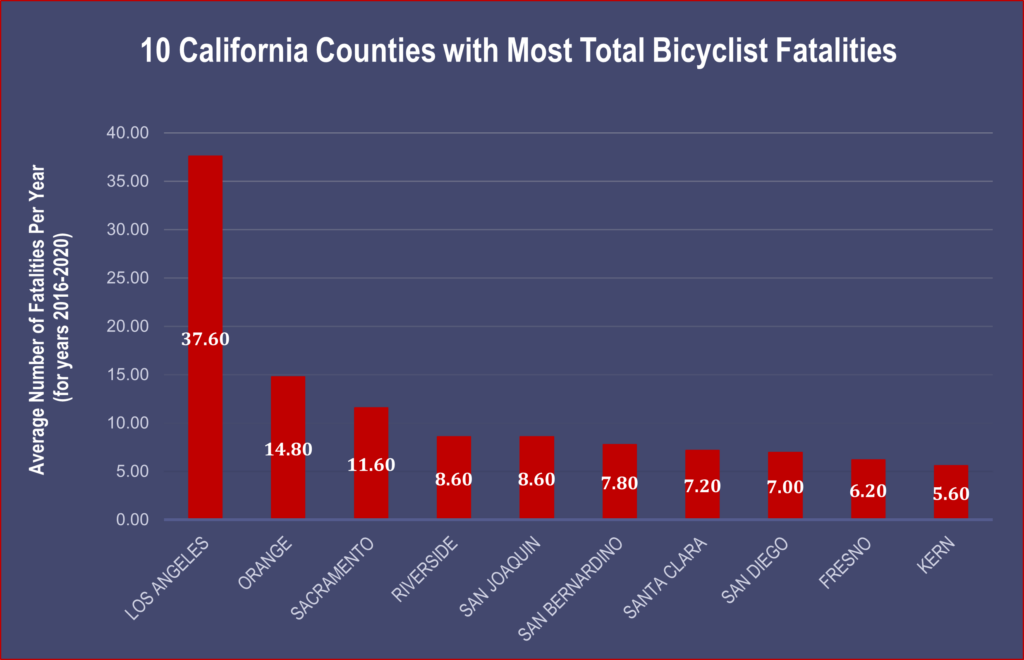
For individual counties in California, Los Angeles County leads all others in the state in bicycle fatalities. (TIMS)
In 2017, Los Angeles was tied for 2nd with Phoenix for the American city with the highest bike death statistics. They both reported 14 fatal accidents that year. New York City led the nation in fatalities with 22 in a year.
However, Los Angeles County is also by far the most populous county in California, meaning that there are just more cyclists on the road. Looking at the rate of fatalities per 100,000 people therefore gives a better idea of how dangerous a county is for bicyclists. (TIMS)
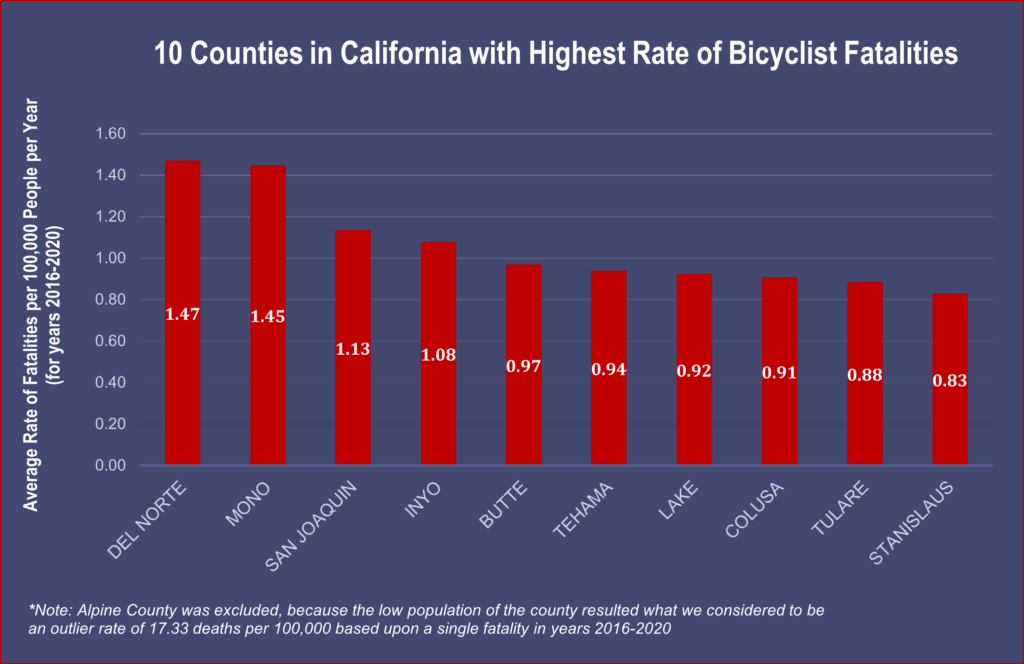
When looking at rates of bicyclist fatalities per 100,000 people (using 2018 population data), Los Angeles county isn’t even in the top 10.
The picture looks a little different when taking into account not just fatalities, but injuries as well. (TIMS)
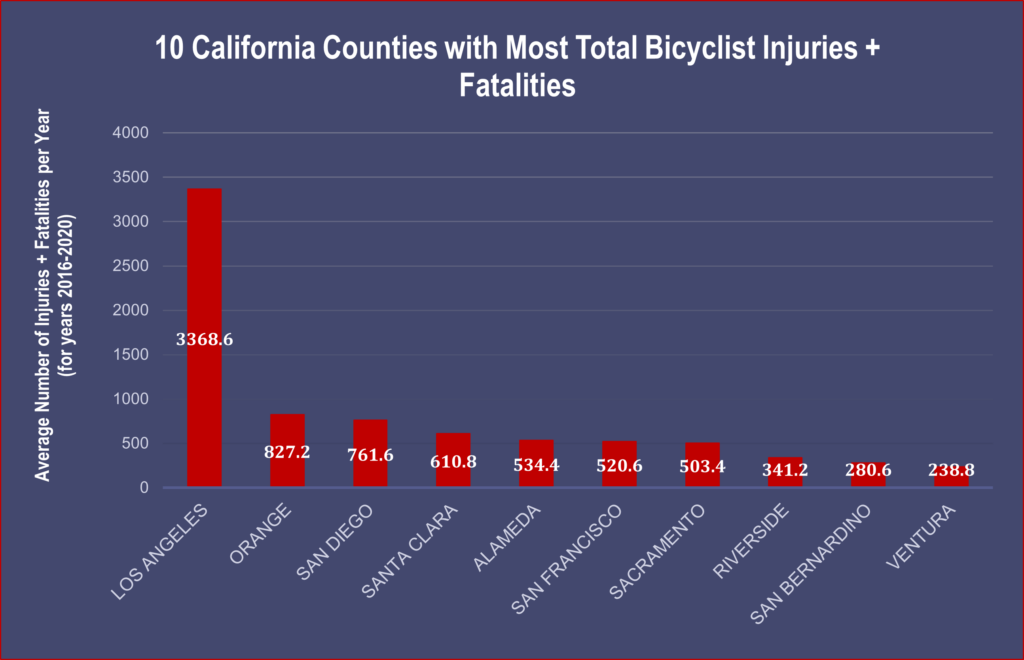
While Los Angeles and Orange counties lead the state in both the number of fatalities, and the number of injuries plus fatalities, there are significant differences in the other counties. For instance, Alameda is the county with the fifth most bicyclist injuries plus fatalities, but not even in the top 10 for fatalities alone. Similarly, San Francisco has the sixth most bike injuries plus fatalities on average, but also is not in the top 10 California counties for bicyclist deaths alone.
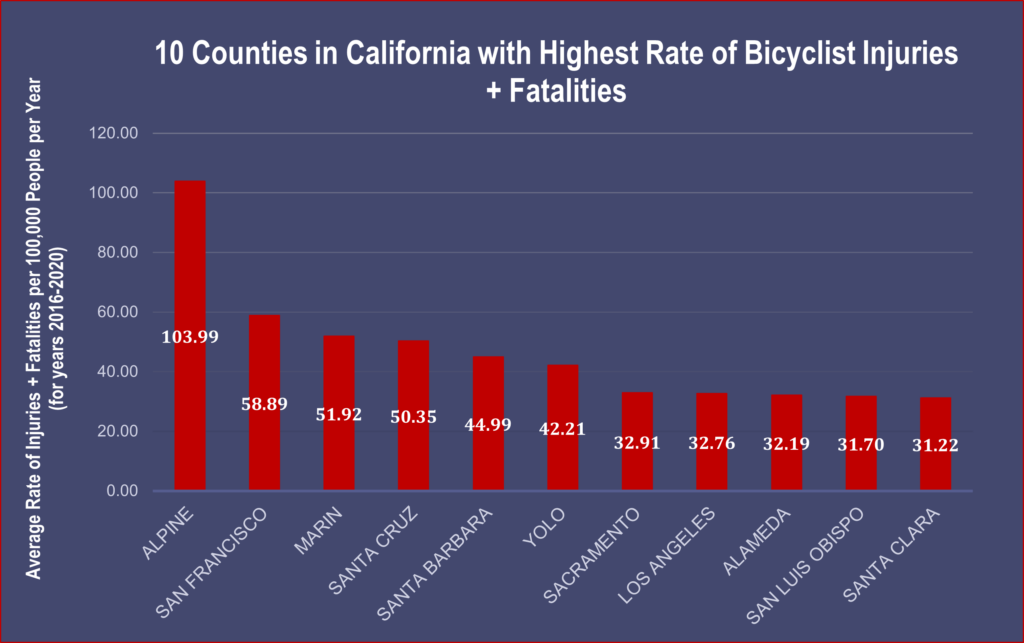
Again, it is also useful to convert these numbers into injuries plus fatalities per 100,000 people in each county, in order to see the rate of injuries plus fatalities. (TIMS)
Bike Deaths Statistics According to Time of Day
The time of day cyclists ride, statistically, makes a big difference in how much risk they face. Rush hour is the most dangerous time to be on the roads for anyone, but for bicyclists, dusk and sundown can also be very hazardous.
These are the national findings on when the most accidents happen (NHTSA):

In California in 2019, 48% of bicycle accidents happened during daylight hours. 28% took place at night with street lights present, while 16% were at night on roads where no streetlights were present. Accidents at dusk or dawn accounted for 7% of accidents. (CDPH)
Bicyclist deaths in 2018 were highest during September (12%) and lowest during March (5%). In 2019, bicyclist deaths in California were highest in January and July (12% each) and lowest in August (5%). (NHTSA)
Fatalities on City Streets and Country Roads
Nationally in 2018, 79% of accidents happened in urban settings. 21% of accidents took place in rural areas. (IIHS) In 2019, about 78% of bicycle collisions were in urban areas while 22% were in rural areas. (NHTSA)

3% of bicycle fatalities happened on Interstates and Freeways.
63% happened on other major roads.
29% happened on minor roads.
Deaths of bicyclists younger than 20 were more likely to occur on minor roads compared with deaths of bicyclists ages 20 and older (44 percent vs. 28 percent).
Age/Gender in Bicycle Fatalities
The age and gender of the cyclist is a significant factor in fatal bike accidents. Understanding the reason for the many differences might help in making the streets safer for cyclists.
In 2018 adult men died on bicycles much more than anyone else, nationally (IIHS).

From 2016 through 2018 in California, nearly eight men lost their lives in bicycle accidents for every woman who died. According to census figures, California men are about twice as likely as women to commute to work by bike. (CaliforniaHealthline)
Bike death statistics in California of the ages of victims in fatal accidents in 2017 looked like this (CAL OTS):

CYCLIST DEATHS AND IMPAIRMENT
In 2018, out of 806 bicyclists killed (ages 16 and up) a stunning 20% had a Blood Alcohol Content of .08 or above (IIHS). That percentage has stayed between 19% and 22% each year for six years.
According to a report from the National Highway Traffic Safety Administration, in 2017 across the nation out of 782 cyclist deaths:
- 289 (37%) Involved alcohol
- 195 (25%) happened when the cyclist was impaired.
- 55 (7%) happened when the motor vehicle driver was impaired.
In California in 2016, out of 154 cyclists’ deaths:
- 57 cyclist deaths occurred when alcohol was involved.
- 39 happened when cyclists were impaired.
- 11 happened when the motor vehicle driver was impaired.
Cyclist Helmets Statistics
California law does not require riders to wear helmets once they turn 18.

Nationwide, sixty-one percent of bicyclists killed in 2018 were not wearing helmets. Helmet use was unknown in 24% of incidents. (IIHS)
In California in 2017, out of 11,148 injured bicyclists, 2,663 were reported as wearing helmets. 8,485 cyclists were not wearing helmets. That means 76% of California cyclists were not wearing a helmet when their accident occurred. (CHP)
STAYING SAFE WHILE CYCLING
In 2018, nationwide there were 424,350 emergency department-treated injuries after bicycles and bicycle accessories related accidents (InjuryFacts). Cyclist deaths accounted for 2% of all motor-vehicle traffic fatalities.
The numbers only underline the dangers that many cyclists face on the streets every day. Hopefully, in looking at the injury and fatality statistics, one can map out a cycling strategy that can increase the odds of avoiding an accident.
Some things you can avoid and other things, like careless or distracted drivers, will always be threats at any time or place you ride. If you have been in a bicycle accident of any kind, please don’t be shy to contact on of our bicycle attorneys, who will be able to help you navigate the aftermath of a serious crash.